
COVID-19 has followed a recurring seasonal rhythm in recent years, with a winter peak and a second, smaller wave in late summer. Our communicable disease data tracker follows both the rate of COVID-19 encounters and the share of positive COVID-19 tests, which together help distinguish a true drop in disease activity from a drop driven by changes in how often people are tested. After several waves of diminishing size, COVID-19 activity has now reached its lowest level since 2023.
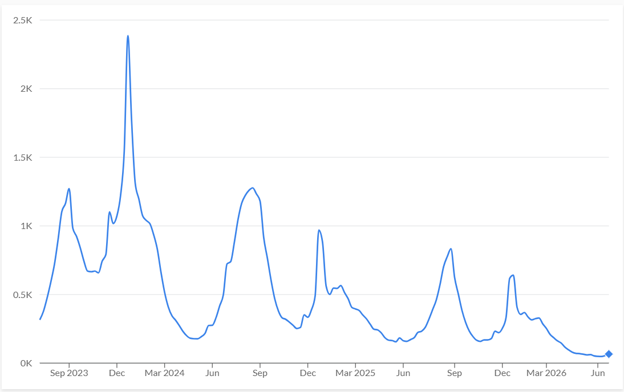
Winter peaks fell from 2,386 encounters per 100,000 patients in late December 2023 to 969 in December 2024 and 641 in December 2025. Late-summer peaks were steady at just under 1,300 per 100,000 patients in 2023 and 2024 before declining to 833 in 2025. By the week of June 14, 2026, the visit rate had fallen to 48.5 per 100,000 patients, the lowest value over the period, and well below the prior warm-season lows of about 177 per 100,000 patients in spring 2024 and 156 per 100,000 patients in spring 2025.
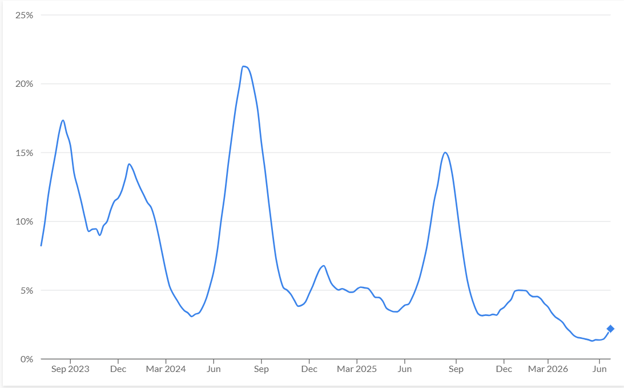
Test positivity followed the same downward trend, which suggests the low visit rate is not simply an artifact of less testing. Positivity reached about 1.4% in early June 2026, roughly half the prior seasonal troughs of around 3%. After the week of May 24, 2026, however, positivity rose consistently, from 1.3% to 2.2%, even as the visit rate remained near its lowest point. The visit rate began to climb again in the weeks of June 21 and 28. In prior years, COVID-19 positivity began climbing about two to three weeks ahead of the corresponding rise in visits during the late-summer season.
These data come from Cosmos, a dataset created in collaboration with a community of Epic health systems representing more than 310 million patient records from 2,000 hospitals and more than 49,000 clinics from all 50 U.S. states, Canada, Lebanon, and Saudi Arabia.


