Interest in the demographic characteristics of people with COVID-19 has been high since the start of the pandemic. Initially, when testing resources were scarce and often limited to the sickest patients, older adults represented a higher proportion of patients than young people. Beginning in June, demographics shifted and young people now represent the largest subgroup of COVID-19 cases.
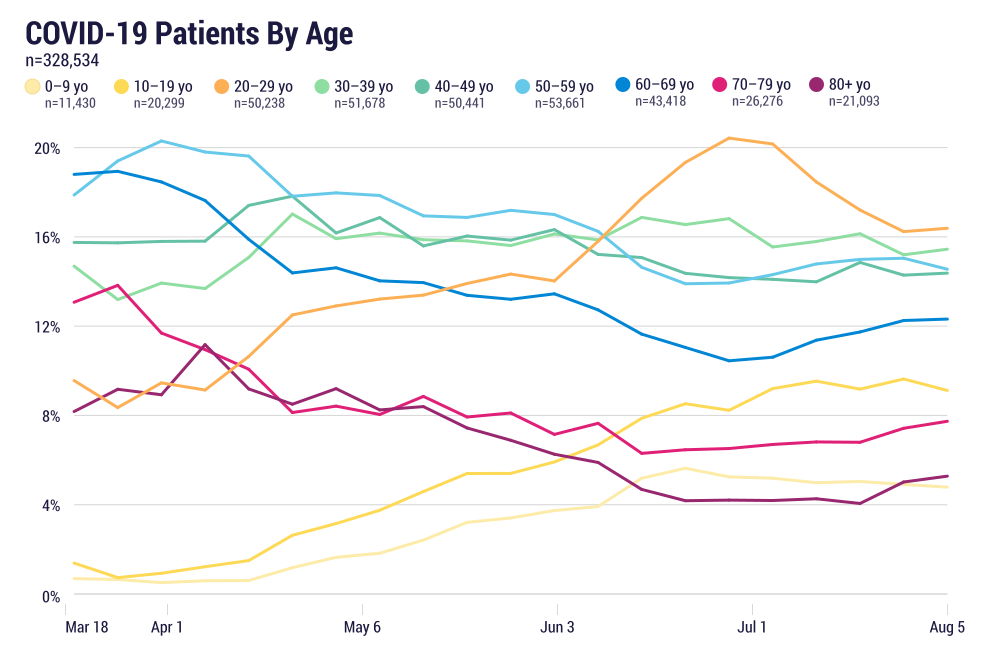
We examined the age distribution of a population of 328,534 COVID-19 patients. The distributions by age decade are shown in the accompanying graphs.
Of note is the significant change of the relative contribution of various age groups over time. Figure 1 shows the relative age distribution of the COVID-19 population in the data set over time. The 0-9, 10-19, and 20-29 year old age groups all show an increase in prevalence with the 20-29 year old group displaying the greatest prevalence by mid-June, while the 70-79 and 80+ age groups show a decline in prevalence.
If this relative increase in COVID-19 patients among younger patients was due to increased testing in these age groups, we would expect to see a lower positive test rate among the tested population. However, as Figure 2 shows, 10-29 year olds have had the highest positive test rate since mid-May.
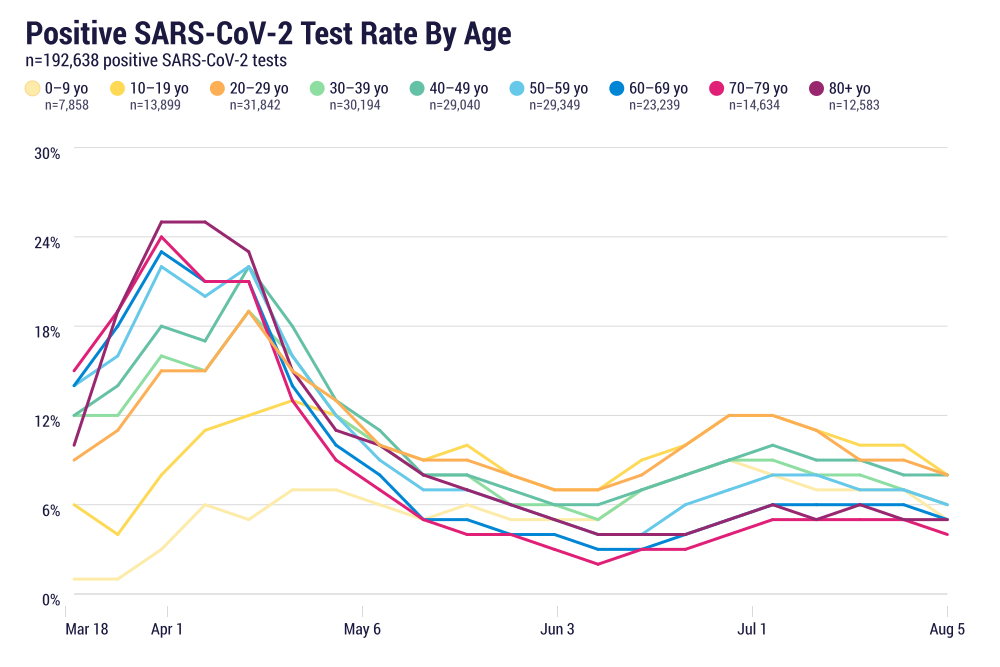
The increased representation of the younger subgroups during the summer surge in COVID-19 prevalence in this population is consistent with the observation that younger people were becoming less observant of precautionary behaviors with warmer weather and the end of the school term. At the same time, prevalence in older age groups decreased such that the older the age, the lower the relative prevalence. This is consistent with anecdotes about more cautionary behaviors in these age groups.
This summary includes 328,534 COVID-19 patients as of August 11, 2020. Data are pooled from 77 healthcare organizations representing 345 hospitals that span 46 states and cover 46 million patients.


