Epic Research is not viewable using Internet Explorer. Please try accessing it with an alternate browser.
Cosmos Study

Elevated Blood Lead Levels Still an Issue for Children in Midwest and Northeast

Abstract: Elevated lead levels in kids are more common in Midwest and Northeast U.S.
August 25, 2021
Dual-Team Study
Team A:Jeff Trinkl, MDEric Barkley
Team B:Doug Winesett, MDJustin Lo, PhD, MT(ASCP)

In the U.S., children are at greater risk of environmental lead exposure if they live in housing built before 1978 or in households at or below the federal poverty level.1 The water crisis in Flint, MI increased the public’s awareness of the dangers of lead exposure and the health inequities for residents in urban and low-income areas.2,3 To take a closer look, we conducted a study of U.S. children’s blood lead levels (BLLs) based on location.4 Our study population consisted of 5.6 million patients born between January 1, 2014, and December 31, 2020, including all BLL results between birth and late June 2021. We included only areas where we had a penetrance of at least 10%. Penetrance measures how representative the sample is by comparing how many children had a face-to-face encounter documented to the number of children 0-4 years old in that location as reported by the U.S. Census Bureau. We excluded locations for which there were fewer than 100 patients with birthdates between January 1, 2014, and December 31, 2020, or where there were fewer than 50 children with documented face-to-face encounters.

As seen in Figure 1, we found there is variation across the U.S. in the proportion of children with elevated blood lead levels, defined by the CDC as greater than or equal to 5 micrograms per deciliter (µg/dL).5 Regionally, the highest percentage of kids with elevated blood lead levels were in the Midwest and Northeast, shown in Figure 2. Additionally, 16 of the top 20 areas with the highest percentage of kids with elevated lead levels were in urban settings.
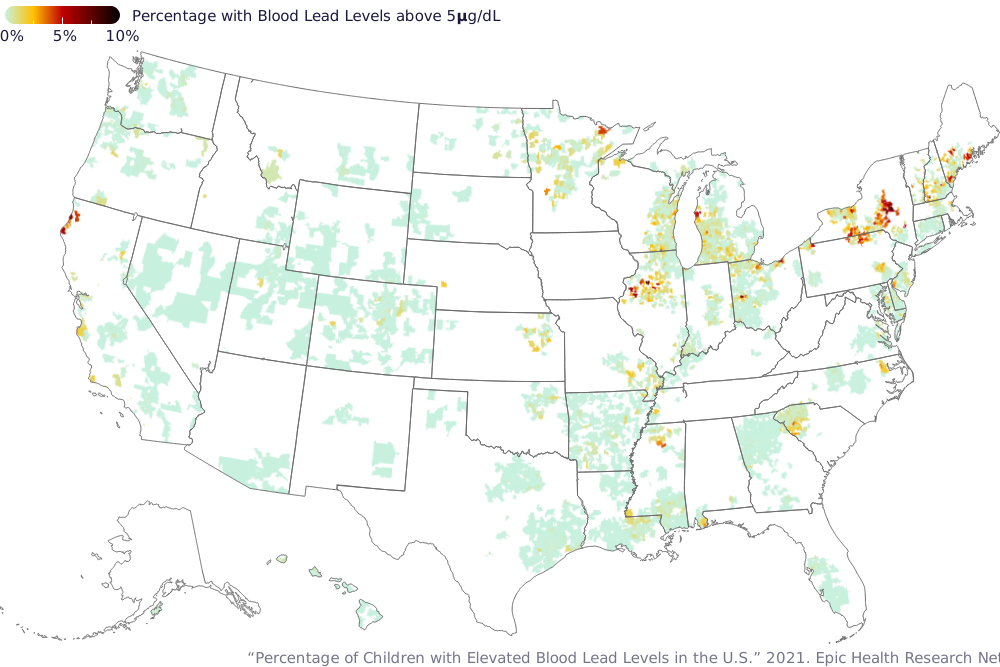
Figure 1
Percentage of Children with Elevated Blood Lead Levels in the U.S.
Figure 1. Geographic representation of U.S. Zip Code Tabulation Areas (ZCTAs) with percentage of children with
blood lead levels above 5 µg/dL. Red areas indicate a greater percentage of increased blood lead levels. Uncolored
areas did not have enough data to report.
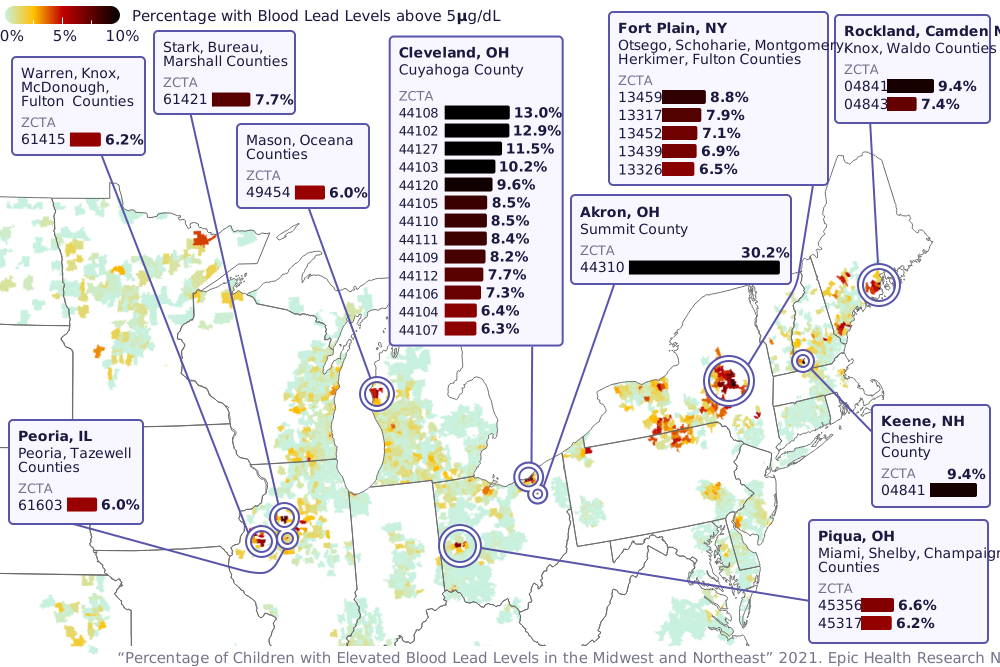
Figure 2
Percentage of Children with Elevated Blood Lead Levels in the Midwest and Northeast
Figure 2. U.S. ZCTAs in the Midwest and Northeast and the percentage of estimated children in the population who
have blood lead levels above 5 µg/dL. Darker red correlates with a higher percentage of children with elevated lead
levels. Uncolored areas did not have enough data to report.
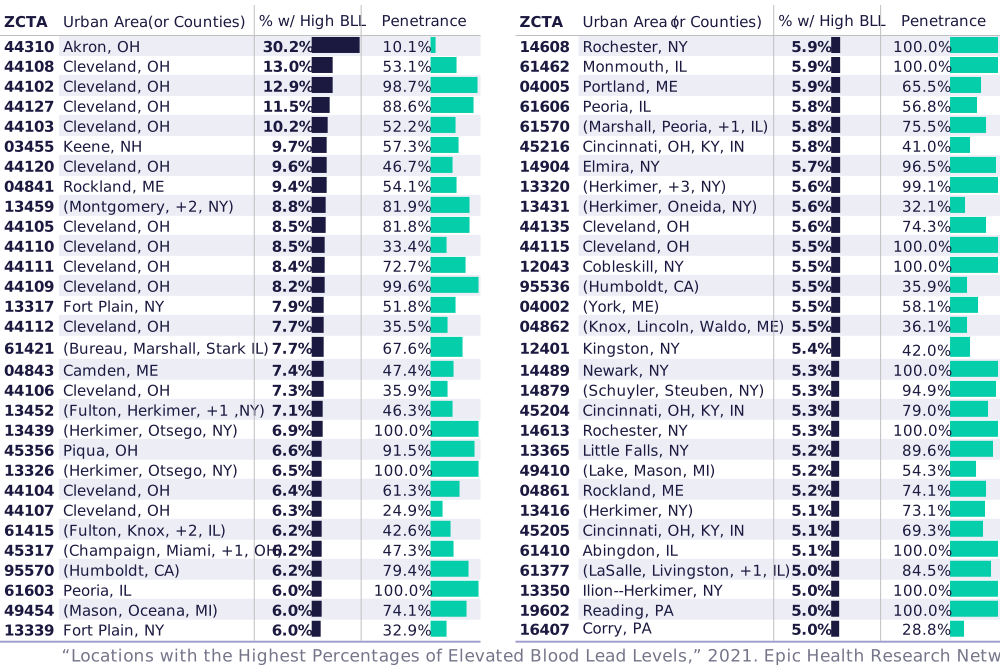
Figure 3
Locations with the Highest Percentages of Elevated Blood Lead Levels
Figure 3. U.S. ZCTAs where the percentage of estimated children in the population that have blood lead levels (BLL)
above 5 µg/dL is 5% or more and penetrance is 10% or more.

There are known variations in blood lead testing in children due to differing screening recommendations and varying levels of risk. This means children with the highest likelihood of elevated lead levels are more likely to be tested.6 Our analysis was limited to blood lead level testing and does not differentiate between testing done for screening purposes versus symptom assessment.


Cosmos is a HIPAA-Limited Data Set of more than 115 million patients from 136 Epic organizations including 705 hospitals and 12,172 clinics, serving patients in all 50 states. This study was completed by two teams, comprised of clinicians and data scientists, that independently acquired and analyzed data. Both teams were involved in the interpretation of results and drafting of this brief. Overall, the two teams came to similar conclusions.

References

  1. CDC. Populations at Higher Risk. https://www.cdc.gov/nceh/lead/prevention/populations.htm. Accessed July 16, 2021.
  2. LeBrón, A., Torres, I. R., Valencia, E., Dominguez, M. L., Garcia-Sanchez, D. G., Logue, M. D., & Wu, J. (2019). The State of Public Health Lead Policies: Implications for Urban Health Inequities and Recommendations for Health Equity. International journal of environmental research and public health, 16(6), 1064. https://doi.org/10.3390/ijerph16061064
  3. Hanna-Attisha M., LaChance J., Sadler R.C., Schnepp A.C. (2016). Elevated blood lead levels in children associated with the Flint drinking water crisis: A spatial analysis of risk and public health response. Am. J. Public Health, 106, 283–290. https://doi.org/10.2105/AJPH.2015.303003
  4. United States Census Bureau. ZIP Code Tabulation Areas (ZCTAs). https://www.census.gov/programs-surveys/geography/guidance/geo-areas/zctas.html. Accessed August 5, 2021.
  5. CDC. Childhood Lead Poisoning Prevention Guidelines and Recommendations. https://www.cdc.gov/nceh/lead/resources/guidelines.html. Accessed July 16, 2021.
  6. CDC. CDC National Childhood Blood Lead Surveillance Data. https://www.cdc.gov/nceh/lead/data/national.htm. Accessed August 16, 2021.