Epic Research is not viewable using Internet Explorer. Please try accessing it with an alternate browser.

Hand, Foot, and Mouth Disease Cases Surge, Especially in Tennessee

October 31, 2025

Key Findings

  • In October, the weekly rate of medically attended hand, foot, and mouth disease (HFMD) reached more than three times the highest weekly rate in 2024 and nearly twice the highest weekly rate in 2023.
  • Many states are experiencing an increase in the rate of HFMD this year. The highest rate is in Tennessee (487 cases per 100,000 patients for early October) where the rate is more than double the national average (218 cases per 100,000 patients for early October).

Cases of hand, foot, and mouth disease (HFMD), which causes fever, mouth sores, and skin rash,1 often increase in the fall. While it is most commonly diagnosed in children under 5, anyone can get it.1 It is one of the conditions tracked on Epic Research’s communicable disease data tracker.

This fall, the increase in cases has been particularly dramatic. Cases of medically attended HFMD reached 221.8 cases per 100,000 patients the week ending October 11, more than three times the peak rate in 2024 (76.3 cases per 100,000 patients) and nearly double the peak rate in 2023 (120.3 cases per 100,000 patients), as shown in figure 1.
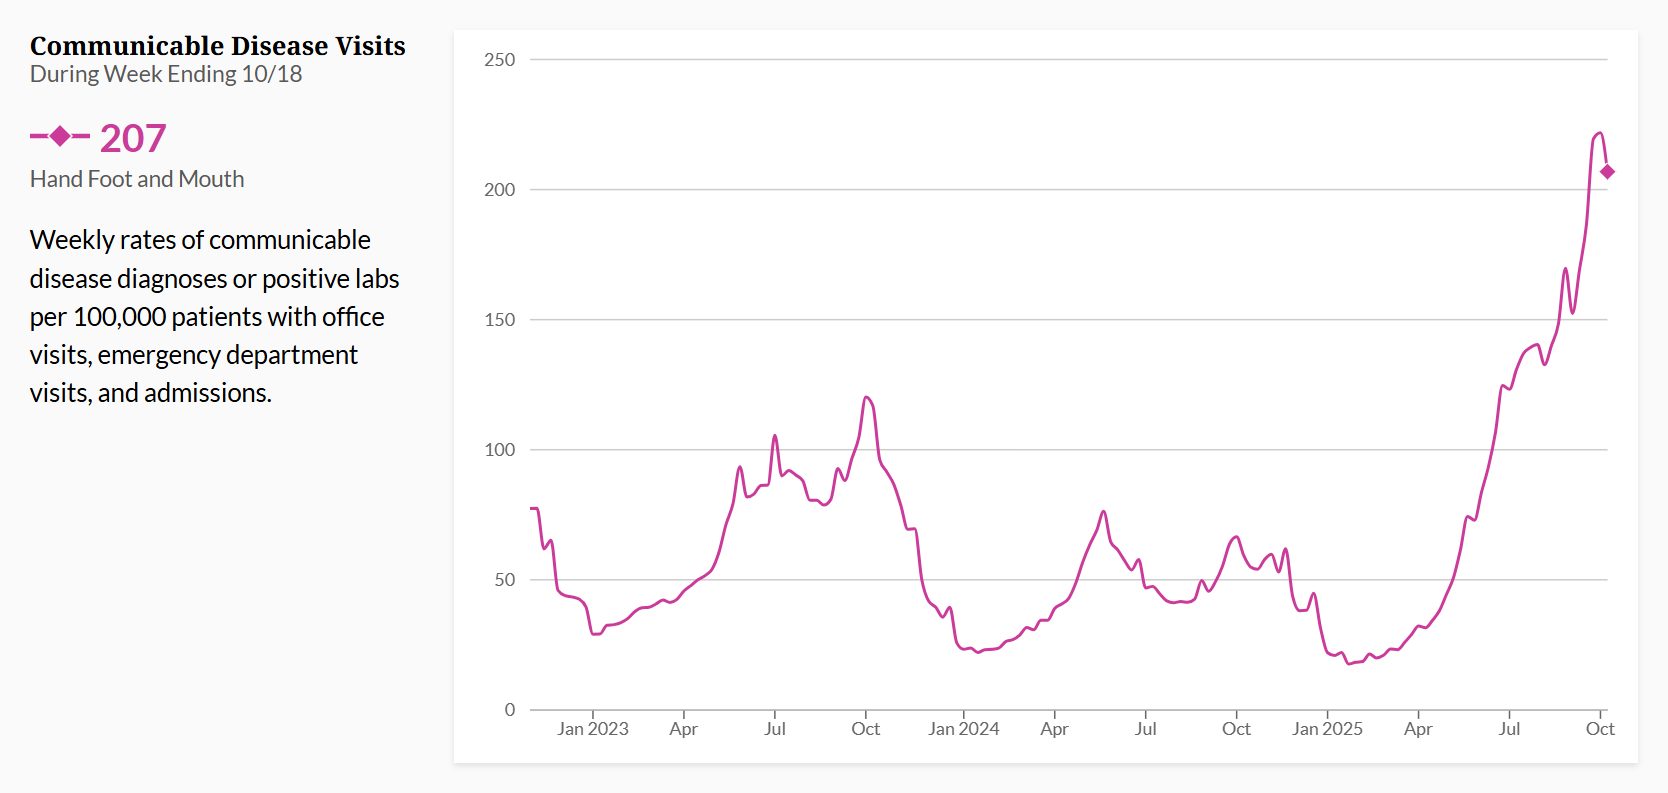
Figure 1
Cases of Hand, Foot, and Mouth Disease Over Time
Figure 1. Rate of medically attended HFMD cases per 100,000 patients with an office visit, emergency department visit, or hospital admission by week from October 30, 2022, to October 18, 2025.

While this rise has been seen across the United States, Tennessee has been particularly affected, with dozens of schools experiencing outbreaks,2 as shown in figure 2. The rate in Tennessee between October 5 and October 18 was more than twice the national average (487 cases per 100,000 patients compared to 218 cases per 100,000 patients). Other states with rates much higher than the national average include Delaware (418 cases per 100,000 patients), Iowa (387 cases per 100,000 patients), and Georgia (378 cases per 100,000 patients).

Figure 2
Cases of Hand, Foot, and Mouth Disease by State Between October 5 and October 18, 2025
Figure 2. Rate of medically attended HFMD cases per 100,000 patients with an office visit, emergency department visit, or hospital admission by state from October 5 to October 18, 2025.

These data come from Cosmos, a dataset created in collaboration with a community of Epic health systems representing more than 300 million patient records from 1,800 hospitals and more than 41,000 clinics from all 50 U.S. states, Canada, Lebanon, and Saudi Arabia.

References

  1. Centers for Disease Control and Prevention. About Hand, Foot, and Mouth Disease. 2024 May 7. Accessed October 31, 2025. https://www.cdc.gov/hand-foot-mouth/about/index.html
  2. Kekatos M. Hand, foot, and mouth disease outbreak hits 31 schools, day cares in Tennessee county. ABC News. October 22, 2025. Accessed October 31, 2025. https://abcnews.go.com/US/hand-foot-mouth-disease-outbreak-hits-31-schools/story?id=126752726
