Epic Research is not viewable using Internet Explorer. Please try accessing it with an alternate browser.
Cosmos Study

Prevalence of Comorbidities in COVID-19 Related Hospitalizations and Deaths

Abstract: COVID-19 patients with diabetes and hypertension are hospitalized and die at higher rates than the general population.
May 4, 2020

COVID-19 hospitalization and mortality information were assessed in a sample of 36 million active patients.1 Nearly 10 million of those patients have documented hypertension, diabetes, chronic obstructive pulmonary disease (COPD), or moderate/severe asthma as of April 30, 2020. The summarized data were contributed by 31 health systems (300 hospitals) across 18 states. Table 1 shows the prevalence of these conditions in the sample data set as compared to national baselines for adults.
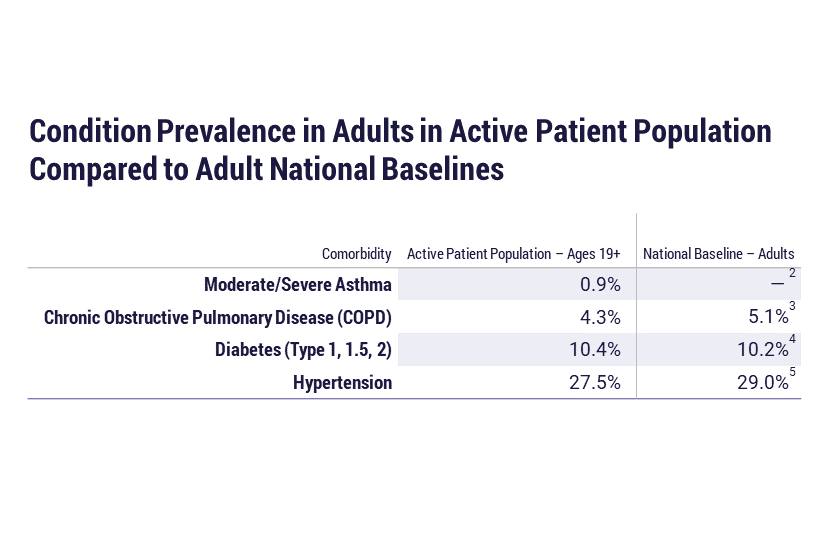
Figure 1
Condition prevalence in adults in active patient population compared to adult national baselines
Table 1: Prevalence of examined conditions in adults in the active patient population as compared to national baselines.

In this sample, 124,783 patients were COVID-19 positive. There are 52,163 (42%) patients who do not yet have a known outcome as of April 30, 2020. These patients may or may not escalate further to hospitalization or death.

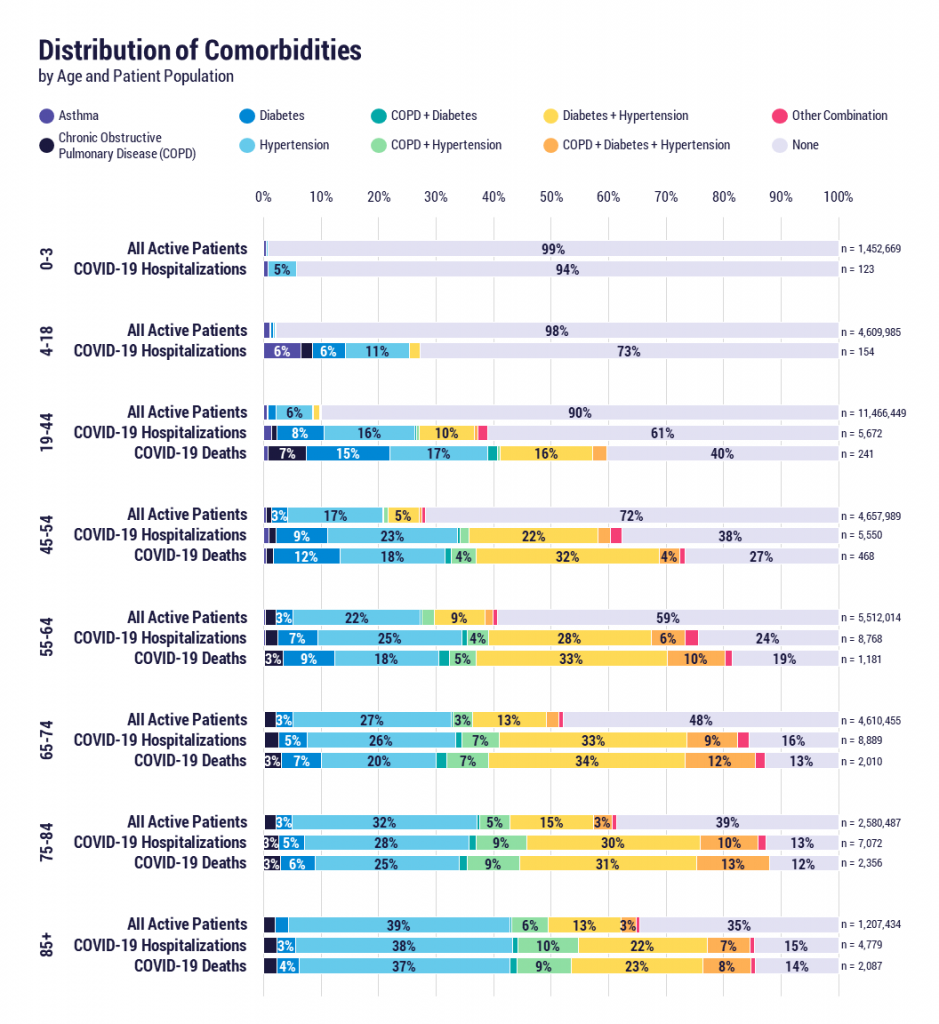
The charts below show how the four included comorbidities are distributed across the whole sample, across COVID-19 positive hospitalized patients, and then across COVID-19 related deaths. These subpopulations are not mutually exclusive. For example, a COVID-19 positive patient who was hospitalized then died would appear in all three patient populations. Figure 1 shows these metrics grouped by sex, while Figure 2 shows these metrics grouped by age group.

Generally, the prevalence of COPD, diabetes, hypertension, and various combinations of these comorbidities appears higher in COVID-19 hospitalized patients and COVID-19 deaths than in the overall active patient population. Specifically, the combination of diabetes and hypertension appears to show a proportionally higher representation among hospitalizations and deaths. There does not appear to be much variation in prevalence of comorbidities across sexes. This information may help clinicians understand which of their COVID-19 patients may be at heightened risk for severe illness.  
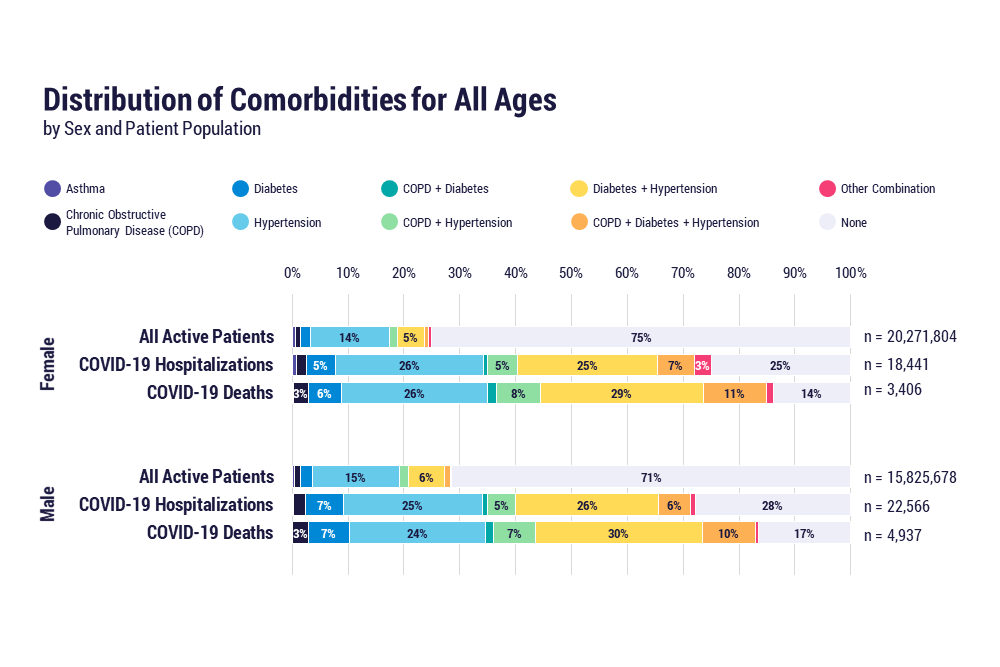
Figure 2
Distribution of comorbidities for all ages by sex and patient population
Figure 1. Distribution of comorbidities by sex for all active patients, COVID-19 positive hospitalized patients, and COVID-19 related deaths.
Figure 3
Distribution of comorbidities by age and patient population
Figure 2. Distribution of comorbidities by age group for all active patients, COVID-19 positive hospitalized patients, and COVID-19 related deaths. COVID-19 related deaths are not shown for patients age 18 years and under due to small sample size (n = 7).

References:

References

  1. Download the full PDF to see definitions.
  2. While there are national baselines for asthma generally, there is not a known national baseline for moderate/severe asthma, which is what is used in this analysis.
  3. Akinbami, Omolara Jean, and Xiang Liu. Chronic Obstructive Pulmonary Disease Among Adults Aged 18 and Over in the United States, 1998-2009. Hyattsville, MD: US Department of Health and Human Services, Centers for Disease Control and Prevention, National Center for Health Statistics, 2011.
  4. Chronic obstructive pulmonary disease is a child code under the SNOMED code used in our search for chronic obstructive lung disease. There is not a known national baseline for COPD, which was used in this analysis.
  5. Centers for Disease Control and Prevention. “National diabetes statistics report, 2020.” Atlanta, GA: Centers for Disease Control and Prevention, US Department of Health and Human Services (2020).
  6. “Hypertension Prevalence and Control Among Adults: United States, 2015–2016.” Centers for Disease Control and Prevention, Centers for Disease Control and Prevention, 18 Oct. 2017, www.cdc.gov/nchs/products/databriefs/db289.htm.